
-
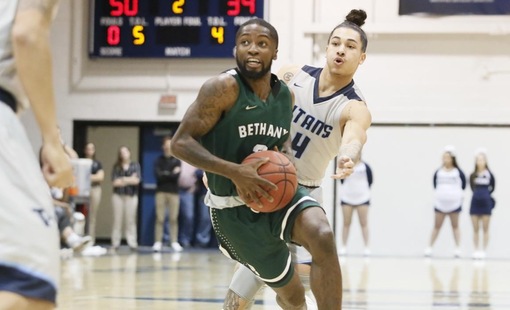
- Height:
- 6-2
-
- Year:
- Sr.
-
- Hometown:
- Oil City, Pa.
-
- High School:
- Oil City
-
- Position:
- G
-
- gp
- 21
-
- pts/g
- 11.5
-
- fg %
- 44.4
-
- 3pt %
- 20.4
-
- ft %
- 75.5
-
- reb/g
- 3.8
-
- a/g
- 0.9
Bio
2016-17 (JUNIOR)
Started all 30 games ... ranked second on the team and 13th in the PAC with 12.8 ppg. ... finished with 2.4 rebounds and 1.3 assists per game ... led the team and ranked third in the PAC with an .829 free-throw percentage ... finished second on the team and 10th in the PAC with a .370 three-point field goal percentage ... Mount Aloysius Coaches vs. Cancer Tournament MVP ... ECAC All-Tournament Team ... five 20-point games ... scored 13 points with a season-high eight rebounds versus Chatham ... dropped 21 points, including a season-high five three pointers, versus Thomas More ... tallied 20 points with a season-high five assists in the first round of the ECAC Tournament against Penn State-Altoona ... scored a season-high 25 points in the ECAC Quarterfinals versus Moravian
2015-16 (SOPHOMORE)
Made 24 appearances with 15 starts ... shot 44 percent from the field, 40 percent from three-point range, and 74 percent from the free-throw line ... totaled double-digit scoring on 16 occasions, including a career-high 29 points in a double-overtime victory over Thomas More
2014-15 (FRESHMAN)
Appeared in 25 games in a reserve role ... averaged 2.1 points and 1.1 rebounds per night ... shot .895 from the charity stripe ... season-high nine points twice
HIGH SCHOOL
Played at Oil City for Head Coach Mark Cochran ... all-region ... Holiday Tournament MVP
PERSONAL
Son of David and Jewell Williams ... has four brothers and two sisters ... cousin of former Bethany basketball player Antonio Rudolph ... majoring in comnunications and media arts
Player Profile
| Overall | Conf | |||
|---|---|---|---|---|
| Games | 21 | 13 | ||
| Games started | 9 | 1 | ||
| Minutes | 524 | 292 | ||
| Minutes per game | 25.0 | 22.5 | ||
| FG | 80-180 | 46-101 | ||
| FG Pct | 44.4 | 45.5 | ||
| 3PT | 11-54 | 5-24 | ||
| 3PT Pct | 20.4 | 20.8 | ||
| FT | 71-94 | 38-51 | ||
| FT Pct | 75.5 | 74.5 | ||
| Off rebounds | 13 | 9 | ||
| Def rebounds | 67 | 36 | ||
| Total rebounds | 80 | 45 | ||
| Rebounds per game | 3.8 | 3.5 | ||
| Personal fouls | 15 | 10 | ||
| Disqualifications | - | - | ||
| Assists | 19 | 9 | ||
| Turnovers | 26 | 18 | ||
| Assist to turnover ratio | 0.7 | 0.5 | ||
| Steals | 14 | 7 | ||
| Blocks | 3 | 2 | ||
| Points | 242 | 135 | ||
| Points per game | 11.5 | 10.4 | ||
| Points per 40 min | 18.5 | 18.5 | ||
Game Log - Shooting
| Date | Opponent | Score | gs | min | fg | pct | 3pt | pct | ft | pct | pts |
|---|---|---|---|---|---|---|---|---|---|---|---|
| Nov 15 | at Susquehanna | L, 75-73 | 1 | 33 | 6-13 | 46.2 | 0-4 | 0.0 | 3-6 | 50.0 | 15 |
| Nov 17 | at Franklin & Marshall | L, 72-70 | 1 | 25 | 1-7 | 14.3 | 0-3 | 0.0 | 8-8 | 100.0 | 10 |
| Nov 18 | vs. Lancaster Bible | L, 83-69 | 1 | 29 | 2-11 | 18.2 | 0-5 | 0.0 | 4-4 | 100.0 | 8 |
| Nov 21 | at Carnegie Mellon | L, 59-58 | - | - | - | - | - | - | - | - | - |
| Nov 26 | #13 Marietta | L, 83-70 | - | - | - | - | - | - | - | - | - |
| Nov 29 | Geneva | W, 70-60 | - | - | - | - | - | - | - | - | - |
| Dec 2 | Thomas More | W, 72-65 | - | - | - | - | - | - | - | - | - |
| Dec 6 | at Waynesburg | W, 73-65 | - | - | - | - | - | - | - | - | - |
| Dec 9 | at Westminster (Pa.) | L, 90-69 | - | - | - | - | - | - | - | - | - |
| Dec 18 | at St. Francis (Pa.) | L, 113-77 | - | - | - | - | - | - | - | - | - |
| Dec 29 | at Baldwin Wallace | L, 94-71 | - | - | - | - | - | - | - | - | - |
| Jan 3 | St. Vincent | L, 71-57 | - | - | - | - | - | - | - | - | - |
| Jan 6 | at Thiel | W, 74-71 | - | 22 | 2-5 | 40.0 | 1-1 | 100.0 | 2-2 | 100.0 | 7 |
| Jan 10 | Wash. & Jeff. | W, 69-66 | - | 28 | 6-13 | 46.2 | 1-4 | 25.0 | 7-11 | 63.6 | 20 |
| Jan 13 | Grove City | W, 75-55 | - | 15 | 2-6 | 33.3 | 0-2 | 0.0 | 2-2 | 100.0 | 6 |
| Jan 17 | at Chatham | W, 78-64 | - | 17 | 3-6 | 50.0 | 1-2 | 50.0 | 1-1 | 100.0 | 8 |
| Jan 20 | Waynesburg | W, 93-77 | - | 19 | 2-4 | 50.0 | 0-1 | 0.0 | 0-0 | - | 4 |
| Jan 24 | at Geneva | W, 80-66 | - | 24 | 4-8 | 50.0 | 0-2 | 0.0 | 3-4 | 75.0 | 11 |
| Jan 27 | Westminster (Pa.) | W, 76-69 | - | 24 | 3-9 | 33.3 | 0-2 | 0.0 | 3-3 | 100.0 | 9 |
| Jan 31 | at Thomas More | L, 80-68 | - | 20 | 2-5 | 40.0 | 0-2 | 0.0 | 4-4 | 100.0 | 8 |
| Feb 3 | Thiel | W, 80-77 | - | 26 | 3-6 | 50.0 | 0-1 | 0.0 | 3-5 | 60.0 | 9 |
| Feb 7 | at St. Vincent | W, 70-57 | - | 16 | 2-5 | 40.0 | 0-0 | - | 3-4 | 75.0 | 7 |
| Feb 10 | at Wash. & Jeff. | W, 89-69 | - | 25 | 4-7 | 57.1 | 0-1 | 0.0 | 3-5 | 60.0 | 11 |
| Feb 14 | Chatham | W, 82-59 | 1 | 29 | 9-18 | 50.0 | 1-3 | 33.3 | 1-2 | 50.0 | 20 |
| Feb 17 | at Grove City | L, 66-57 | - | 27 | 4-9 | 44.4 | 1-3 | 33.3 | 6-8 | 75.0 | 15 |
| Feb 20 | Waynesburg | W, 82-73 | 1 | 25 | 3-9 | 33.3 | 0-3 | 0.0 | 3-4 | 75.0 | 9 |
| Feb 22 | Westminster (Pa.) | W, 76-72 | 1 | 33 | 5-12 | 41.7 | 1-4 | 25.0 | 4-6 | 66.7 | 15 |
| Feb 24 | at Thomas More | L, 78-73 | 1 | 28 | 5-10 | 50.0 | 2-5 | 40.0 | 2-4 | 50.0 | 14 |
| Feb 28 | Penn St.-Altoona | W, 71-66 | 1 | 26 | 8-10 | 80.0 | 2-3 | 66.7 | 5-6 | 83.3 | 23 |
| Mar 2 | vs. Medaille | L, 101-87 | 1 | 33 | 4-7 | 57.1 | 1-3 | 33.3 | 4-5 | 80.0 | 13 |
Game Log - Ball control
| Date | Opponent | Score | gs | min | off | def | reb | ast | to | a/to | stl | blk | pf | dq |
|---|---|---|---|---|---|---|---|---|---|---|---|---|---|---|
| Nov 15 | at Susquehanna | L, 75-73 | 1 | 33 | 0 | 7 | 7 | 0 | 2 | 0.0 | 0 | 0 | 1 | - |
| Nov 17 | at Franklin & Marshall | L, 72-70 | 1 | 25 | 3 | 2 | 5 | 1 | 0 | - | 2 | 0 | 1 | - |
| Nov 18 | vs. Lancaster Bible | L, 83-69 | 1 | 29 | 1 | 3 | 4 | 2 | 1 | 2.0 | 2 | 0 | 1 | - |
| Nov 21 | at Carnegie Mellon | L, 59-58 | - | - | - | - | - | - | - | - | - | - | - | - |
| Nov 26 | #13 Marietta | L, 83-70 | - | - | - | - | - | - | - | - | - | - | - | - |
| Nov 29 | Geneva | W, 70-60 | - | - | - | - | - | - | - | - | - | - | - | - |
| Dec 2 | Thomas More | W, 72-65 | - | - | - | - | - | - | - | - | - | - | - | - |
| Dec 6 | at Waynesburg | W, 73-65 | - | - | - | - | - | - | - | - | - | - | - | - |
| Dec 9 | at Westminster (Pa.) | L, 90-69 | - | - | - | - | - | - | - | - | - | - | - | - |
| Dec 18 | at St. Francis (Pa.) | L, 113-77 | - | - | - | - | - | - | - | - | - | - | - | - |
| Dec 29 | at Baldwin Wallace | L, 94-71 | - | - | - | - | - | - | - | - | - | - | - | - |
| Jan 3 | St. Vincent | L, 71-57 | - | - | - | - | - | - | - | - | - | - | - | - |
| Jan 6 | at Thiel | W, 74-71 | - | 22 | 0 | 2 | 2 | 1 | 2 | 0.5 | 0 | 0 | 1 | - |
| Jan 10 | Wash. & Jeff. | W, 69-66 | - | 28 | 0 | 3 | 3 | 1 | 0 | - | 1 | 0 | 1 | - |
| Jan 13 | Grove City | W, 75-55 | - | 15 | 0 | 0 | 0 | 0 | 1 | 0.0 | 1 | 0 | 1 | - |
| Jan 17 | at Chatham | W, 78-64 | - | 17 | 1 | 1 | 2 | 0 | 1 | 0.0 | 0 | 0 | 0 | - |
| Jan 20 | Waynesburg | W, 93-77 | - | 19 | 0 | 2 | 2 | 3 | 0 | - | 0 | 2 | 1 | - |
| Jan 24 | at Geneva | W, 80-66 | - | 24 | 0 | 3 | 3 | 1 | 1 | 1.0 | 0 | 0 | 1 | - |
| Jan 27 | Westminster (Pa.) | W, 76-69 | - | 24 | 1 | 6 | 7 | 0 | 2 | 0.0 | 0 | 0 | 1 | - |
| Jan 31 | at Thomas More | L, 80-68 | - | 20 | 0 | 2 | 2 | 0 | 1 | 0.0 | 1 | 0 | 1 | - |
| Feb 3 | Thiel | W, 80-77 | - | 26 | 1 | 7 | 8 | 2 | 1 | 2.0 | 1 | 0 | 1 | - |
| Feb 7 | at St. Vincent | W, 70-57 | - | 16 | 0 | 2 | 2 | 0 | 2 | 0.0 | 1 | 0 | 0 | - |
| Feb 10 | at Wash. & Jeff. | W, 89-69 | - | 25 | 1 | 4 | 5 | 0 | 0 | - | 0 | 0 | 0 | - |
| Feb 14 | Chatham | W, 82-59 | 1 | 29 | 3 | 1 | 4 | 1 | 3 | 0.3 | 1 | 0 | 0 | - |
| Feb 17 | at Grove City | L, 66-57 | - | 27 | 2 | 3 | 5 | 0 | 4 | 0.0 | 1 | 0 | 2 | - |
| Feb 20 | Waynesburg | W, 82-73 | 1 | 25 | 0 | 6 | 6 | 1 | 0 | - | 0 | 0 | 1 | - |
| Feb 22 | Westminster (Pa.) | W, 76-72 | 1 | 33 | 0 | 1 | 1 | 2 | 1 | 2.0 | 0 | 0 | 0 | - |
| Feb 24 | at Thomas More | L, 78-73 | 1 | 28 | 0 | 4 | 4 | 2 | 1 | 2.0 | 0 | 1 | 0 | - |
| Feb 28 | Penn St.-Altoona | W, 71-66 | 1 | 26 | 0 | 5 | 5 | 2 | 2 | 1.0 | 1 | 0 | 0 | - |
| Mar 2 | vs. Medaille | L, 101-87 | 1 | 33 | 0 | 3 | 3 | 0 | 1 | 0.0 | 2 | 0 | 1 | - |
Career Stats - Shooting per game
| gp | gs | min/g | fg/g | pct | 3pt/g | pct | ft/g | pct | ppg | |
|---|---|---|---|---|---|---|---|---|---|---|
| 2014-15 | 25 | - | 10.8 | 0.6-1.7 | 34.9 | 0.2-0.7 | 27.8 | 0.7-0.8 | 89.5 | 2.1 |
| 2015-16 | 24 | 15 | 24.8 | 3.5-8.0 | 44.0 | 1.9-4.7 | 40.7 | 2.3-3.1 | 74.3 | 11.3 |
| 2016-17 | 30 | 30 | 28.7 | 3.9-9.4 | 41.3 | 1.7-4.6 | 37.0 | 3.4-4.1 | 82.9 | 12.8 |
| 2017-18 | 21 | 9 | 25.0 | 3.8-8.6 | 44.4 | 0.5-2.6 | 20.4 | 3.4-4.5 | 75.5 | 11.5 |
| Total | 100 | 54 | 22.5 | 3.0-7.0 | 42.5 | 1.1-3.2 | 35.0 | 2.5-3.1 | 79.0 | 9.5 |
Career Stats - Shooting totals
| gp | gs | min | fg | pct | 3pt | pct | ft | pct | pts | |
|---|---|---|---|---|---|---|---|---|---|---|
| 2014-15 | 25 | - | 271 | 15-43 | 34.9 | 5-18 | 27.8 | 17-19 | 89.5 | 52 |
| 2015-16 | 24 | 15 | 594 | 85-193 | 44.0 | 46-113 | 40.7 | 55-74 | 74.3 | 271 |
| 2016-17 | 30 | 30 | 862 | 116-281 | 41.3 | 51-138 | 37.0 | 102-123 | 82.9 | 385 |
| 2017-18 | 21 | 9 | 524 | 80-180 | 44.4 | 11-54 | 20.4 | 71-94 | 75.5 | 242 |
| Total | 100 | 54 | 2251 | 296-697 | 42.5 | 113-323 | 35.0 | 245-310 | 79.0 | 950 |
Career Stats - Shooting per 40 min
| gp | gs | min/g | fg/40 | pct | 3pt/40 | pct | ft/40 | pct | pts/40 | |
|---|---|---|---|---|---|---|---|---|---|---|
| 2014-15 | 25 | - | 10.8 | 2.2-6.3 | 34.9 | 0.7-2.7 | 27.8 | 2.5-2.8 | 89.5 | 7.7 |
| 2015-16 | 24 | 15 | 24.8 | 5.7-13.0 | 44.0 | 3.1-7.6 | 40.7 | 3.7-5.0 | 74.3 | 18.2 |
| 2016-17 | 30 | 30 | 28.7 | 5.4-13.0 | 41.3 | 2.4-6.4 | 37.0 | 4.7-5.7 | 82.9 | 17.9 |
| 2017-18 | 21 | 9 | 25.0 | 6.1-13.7 | 44.4 | 0.8-4.1 | 20.4 | 5.4-7.2 | 75.5 | 18.5 |
| Total | 100 | 54 | 22.5 | 5.3-12.4 | 42.5 | 2.0-5.7 | 35.0 | 4.4-5.5 | 79.0 | 16.9 |
Career Stats - Ball control per game
| gp | gs | mpg | off/g | def/g | reb/g | pf/g | dq/g | ast/g | to/g | a/to | stl/g | blk/g | |
|---|---|---|---|---|---|---|---|---|---|---|---|---|---|
| 2014-15 | 25 | - | 10.8 | 0.2 | 0.9 | 1.1 | 0.8 | 0.0 | 0.3 | 0.2 | 1.3 | 0.4 | 0.1 |
| 2015-16 | 24 | 15 | 24.8 | 0.3 | 2.2 | 2.5 | 1.4 | 0.0 | 1.2 | 1.0 | 1.3 | 0.7 | 0.1 |
| 2016-17 | 30 | 30 | 28.7 | 0.6 | 1.8 | 2.4 | 2.0 | 0.0 | 1.3 | 1.8 | 0.7 | 0.6 | 0.3 |
| 2017-18 | 21 | 9 | 25.0 | 0.6 | 3.2 | 3.8 | 0.7 | - | 0.9 | 1.2 | 0.7 | 0.7 | 0.1 |
| Total | 100 | 54 | 22.5 | 0.4 | 2.0 | 2.4 | 1.3 | 0.0 | 1.0 | 1.1 | 0.9 | 0.6 | 0.2 |
Career Stats - Ball control totals
Career Stats - Ball control per 40 min
| gp | gs | mpg | off/40 | def/40 | reb/40 | pf/40 | dq/40 | ast/40 | to/40 | a/to | stl/40 | blk/40 | |
|---|---|---|---|---|---|---|---|---|---|---|---|---|---|
| 2014-15 | 25 | - | 10.8 | 0.7 | 3.2 | 4.0 | 2.8 | 0.0 | 1.2 | 0.9 | 1.3 | 1.3 | 0.3 |
| 2015-16 | 24 | 15 | 24.8 | 0.4 | 3.6 | 4.0 | 2.3 | 0.0 | 2.0 | 1.5 | 1.3 | 1.1 | 0.2 |
| 2016-17 | 30 | 30 | 28.7 | 0.8 | 2.6 | 3.4 | 2.7 | 0.0 | 1.9 | 2.5 | 0.7 | 0.9 | 0.4 |
| 2017-18 | 21 | 9 | 25.0 | 1.0 | 5.1 | 6.1 | 1.1 | 0.0 | 1.5 | 2.0 | 0.7 | 1.1 | 0.2 |
| Total | 100 | 54 | 22.5 | 0.7 | 3.5 | 4.2 | 2.3 | 0.0 | 1.7 | 1.9 | 0.9 | 1.0 | 0.3 |
Splits Stats - Shooting per game
| gp | gs | min/g | fg/g | pct | 3pt/g | pct | ft/g | pct | ppg | ||
|---|---|---|---|---|---|---|---|---|---|---|---|
| Event | Total | 21 | 9 | 25.0 | 3.8-8.6 | 44.4 | 0.5-2.6 | 20.4 | 3.4-4.5 | 75.5 | 11.5 |
| Conference | 13 | 1 | 22.5 | 3.5-7.8 | 45.5 | 0.4-1.8 | 20.8 | 2.9-3.9 | 74.5 | 10.4 | |
| Exhibition | - | - | - | 0.0-0.0 | - | 0.0-0.0 | - | 0.0-0.0 | - | - | |
| Location | Home | 9 | 4 | 25.0 | 4.6-9.7 | 47.1 | 0.6-2.6 | 21.7 | 3.1-4.3 | 71.8 | 12.8 |
| Away | 10 | 3 | 23.7 | 3.3-7.5 | 44.0 | 0.5-2.3 | 21.7 | 3.5-4.6 | 76.1 | 10.6 | |
| Neutral | 2 | 2 | 31.0 | 3.0-9.0 | 33.3 | 0.5-4.0 | 12.5 | 4.0-4.5 | 88.9 | 10.5 | |
| Result | Wins | 14 | 4 | 23.5 | 4.0-8.4 | 47.5 | 0.5-2.1 | 24.1 | 2.9-3.9 | 72.7 | 11.4 |
| Losses | 7 | 5 | 27.9 | 3.4-8.9 | 38.7 | 0.6-3.6 | 16.0 | 4.4-5.6 | 79.5 | 11.9 | |
| Month | November | 3 | 3 | 29.0 | 3.0-10.3 | 29.0 | 0.0-4.0 | 0.0 | 5.0-6.0 | 83.3 | 11.0 |
| January | 8 | - | 21.1 | 3.0-7.0 | 42.9 | 0.4-2.0 | 18.8 | 2.8-3.4 | 81.5 | 9.1 | |
| February | 9 | 5 | 26.1 | 4.8-9.6 | 50.0 | 0.8-2.6 | 30.4 | 3.3-4.9 | 68.2 | 13.7 | |
| March | 1 | 1 | 33.0 | 4.0-7.0 | 57.1 | 1.0-3.0 | 33.3 | 4.0-5.0 | 80.0 | 13.0 |
Splits Stats - Shooting totals
| gp | gs | min | fg | pct | 3pt | pct | ft | pct | pts | ||
|---|---|---|---|---|---|---|---|---|---|---|---|
| Event | Total | 21 | 9 | 524 | 80-180 | 44.4 | 11-54 | 20.4 | 71-94 | 75.5 | 242 |
| Conference | 13 | 1 | 292 | 46-101 | 45.5 | 5-24 | 20.8 | 38-51 | 74.5 | 135 | |
| Exhibition | - | - | - | 0-0 | - | 0-0 | - | 0-0 | - | 0 | |
| Location | Home | 9 | 4 | 225 | 41-87 | 47.1 | 5-23 | 21.7 | 28-39 | 71.8 | 115 |
| Away | 10 | 3 | 237 | 33-75 | 44.0 | 5-23 | 21.7 | 35-46 | 76.1 | 106 | |
| Neutral | 2 | 2 | 62 | 6-18 | 33.3 | 1-8 | 12.5 | 8-9 | 88.9 | 21 | |
| Result | Wins | 14 | 4 | 329 | 56-118 | 47.5 | 7-29 | 24.1 | 40-55 | 72.7 | 159 |
| Losses | 7 | 5 | 195 | 24-62 | 38.7 | 4-25 | 16.0 | 31-39 | 79.5 | 83 | |
| Month | November | 3 | 3 | 87 | 9-31 | 29.0 | 0-12 | 0.0 | 15-18 | 83.3 | 33 |
| January | 8 | - | 169 | 24-56 | 42.9 | 3-16 | 18.8 | 22-27 | 81.5 | 73 | |
| February | 9 | 5 | 235 | 43-86 | 50.0 | 7-23 | 30.4 | 30-44 | 68.2 | 123 | |
| March | 1 | 1 | 33 | 4-7 | 57.1 | 1-3 | 33.3 | 4-5 | 80.0 | 13 |
Splits Stats - Shooting per 40 min
| gp | gs | min/g | fg/40 | pct | 3pt/40 | pct | ft/40 | pct | pts/40 | ||
|---|---|---|---|---|---|---|---|---|---|---|---|
| Event | Total | 21 | 9 | 25.0 | 6.1-13.7 | 44.4 | 0.8-4.1 | 20.4 | 5.4-7.2 | 75.5 | 18.5 |
| Conference | 13 | 1 | 22.5 | 6.3-13.8 | 45.5 | 0.7-3.3 | 20.8 | 5.2-7.0 | 74.5 | 18.5 | |
| Exhibition | - | - | - | 0.0-0.0 | - | 0.0-0.0 | - | 0.0-0.0 | - | - | |
| Location | Home | 9 | 4 | 25.0 | 7.3-15.5 | 47.1 | 0.9-4.1 | 21.7 | 5.0-6.9 | 71.8 | 20.4 |
| Away | 10 | 3 | 23.7 | 5.6-12.7 | 44.0 | 0.8-3.9 | 21.7 | 5.9-7.8 | 76.1 | 17.9 | |
| Neutral | 2 | 2 | 31.0 | 3.9-11.6 | 33.3 | 0.6-5.2 | 12.5 | 5.2-5.8 | 88.9 | 13.5 | |
| Result | Wins | 14 | 4 | 23.5 | 6.8-14.3 | 47.5 | 0.9-3.5 | 24.1 | 4.9-6.7 | 72.7 | 19.3 |
| Losses | 7 | 5 | 27.9 | 4.9-12.7 | 38.7 | 0.8-5.1 | 16.0 | 6.4-8.0 | 79.5 | 17.0 | |
| Month | November | 3 | 3 | 29.0 | 4.1-14.3 | 29.0 | 0.0-5.5 | 0.0 | 6.9-8.3 | 83.3 | 15.2 |
| January | 8 | - | 21.1 | 5.7-13.3 | 42.9 | 0.7-3.8 | 18.8 | 5.2-6.4 | 81.5 | 17.3 | |
| February | 9 | 5 | 26.1 | 7.3-14.6 | 50.0 | 1.2-3.9 | 30.4 | 5.1-7.5 | 68.2 | 20.9 | |
| March | 1 | 1 | 33.0 | 4.8-8.5 | 57.1 | 1.2-3.6 | 33.3 | 4.8-6.1 | 80.0 | 15.8 |
Splits Stats - Ball control per game
| gp | gs | mpg | off/g | def/g | reb/g | pf/g | dq/g | ast/g | to/g | a/to | stl/g | blk/g | ||
|---|---|---|---|---|---|---|---|---|---|---|---|---|---|---|
| Event | Total | 21 | 9 | 25.0 | 0.6 | 3.2 | 3.8 | 0.7 | - | 0.9 | 1.2 | 0.7 | 0.7 | 0.1 |
| Conference | 13 | 1 | 22.5 | 0.7 | 2.8 | 3.5 | 0.8 | - | 0.7 | 1.4 | 0.5 | 0.5 | 0.2 | |
| Exhibition | - | - | - | - | - | - | - | - | - | - | - | - | - | |
| Location | Home | 9 | 4 | 25.0 | 0.6 | 3.4 | 4.0 | 0.7 | - | 1.3 | 1.1 | 1.2 | 0.6 | 0.2 |
| Away | 10 | 3 | 23.7 | 0.7 | 3.0 | 3.7 | 0.7 | - | 0.5 | 1.4 | 0.4 | 0.5 | 0.1 | |
| Neutral | 2 | 2 | 31.0 | 0.5 | 3.0 | 3.5 | 1.0 | - | 1.0 | 1.0 | 1.0 | 2.0 | 0.0 | |
| Result | Wins | 14 | 4 | 23.5 | 0.5 | 3.1 | 3.6 | 0.6 | - | 1.0 | 1.1 | 0.9 | 0.4 | 0.1 |
| Losses | 7 | 5 | 27.9 | 0.9 | 3.4 | 4.3 | 1.0 | - | 0.7 | 1.4 | 0.5 | 1.1 | 0.1 | |
| Month | November | 3 | 3 | 29.0 | 1.3 | 4.0 | 5.3 | 1.0 | - | 1.0 | 1.0 | 1.0 | 1.3 | 0.0 |
| January | 8 | - | 21.1 | 0.3 | 2.4 | 2.6 | 0.9 | - | 0.8 | 1.0 | 0.8 | 0.4 | 0.3 | |
| February | 9 | 5 | 26.1 | 0.8 | 3.7 | 4.4 | 0.4 | - | 1.1 | 1.6 | 0.7 | 0.6 | 0.1 | |
| March | 1 | 1 | 33.0 | 0.0 | 3.0 | 3.0 | 1.0 | - | 0.0 | 1.0 | 0.0 | 2.0 | 0.0 |
Splits Stats - Ball control totals
| gp | gs | min | off | def | reb | pf | dq | ast | to | a/to | stl | blk | ||
|---|---|---|---|---|---|---|---|---|---|---|---|---|---|---|
| Event | Total | 21 | 9 | 524 | 13 | 67 | 80 | 15 | - | 19 | 26 | 0.7 | 14 | 3 |
| Conference | 13 | 1 | 292 | 9 | 36 | 45 | 10 | - | 9 | 18 | 0.5 | 7 | 2 | |
| Exhibition | - | - | - | - | - | - | - | - | - | - | - | - | - | |
| Location | Home | 9 | 4 | 225 | 5 | 31 | 36 | 6 | - | 12 | 10 | 1.2 | 5 | 2 |
| Away | 10 | 3 | 237 | 7 | 30 | 37 | 7 | - | 5 | 14 | 0.4 | 5 | 1 | |
| Neutral | 2 | 2 | 62 | 1 | 6 | 7 | 2 | - | 2 | 2 | 1.0 | 4 | 0 | |
| Result | Wins | 14 | 4 | 329 | 7 | 43 | 50 | 8 | - | 14 | 16 | 0.9 | 6 | 2 |
| Losses | 7 | 5 | 195 | 6 | 24 | 30 | 7 | - | 5 | 10 | 0.5 | 8 | 1 | |
| Month | November | 3 | 3 | 87 | 4 | 12 | 16 | 3 | - | 3 | 3 | 1.0 | 4 | 0 |
| January | 8 | - | 169 | 2 | 19 | 21 | 7 | - | 6 | 8 | 0.8 | 3 | 2 | |
| February | 9 | 5 | 235 | 7 | 33 | 40 | 4 | - | 10 | 14 | 0.7 | 5 | 1 | |
| March | 1 | 1 | 33 | 0 | 3 | 3 | 1 | - | 0 | 1 | 0.0 | 2 | 0 |
Splits Stats - Ball control per 40 min
| gp | gs | mpg | off/40 | def/40 | reb/40 | pf/40 | dq/40 | ast/40 | to/40 | a/to | stl/40 | blk/40 | ||
|---|---|---|---|---|---|---|---|---|---|---|---|---|---|---|
| Event | Total | 21 | 9 | 25.0 | 1.0 | 5.1 | 6.1 | 1.1 | 0.0 | 1.5 | 2.0 | 0.7 | 1.1 | 0.2 |
| Conference | 13 | 1 | 22.5 | 1.2 | 4.9 | 6.2 | 1.4 | 0.0 | 1.2 | 2.5 | 0.5 | 1.0 | 0.3 | |
| Exhibition | - | - | - | - | - | - | - | - | - | - | - | - | - | |
| Location | Home | 9 | 4 | 25.0 | 0.9 | 5.5 | 6.4 | 1.1 | 0.0 | 2.1 | 1.8 | 1.2 | 0.9 | 0.4 |
| Away | 10 | 3 | 23.7 | 1.2 | 5.1 | 6.2 | 1.2 | 0.0 | 0.8 | 2.4 | 0.4 | 0.8 | 0.2 | |
| Neutral | 2 | 2 | 31.0 | 0.6 | 3.9 | 4.5 | 1.3 | 0.0 | 1.3 | 1.3 | 1.0 | 2.6 | 0.0 | |
| Result | Wins | 14 | 4 | 23.5 | 0.9 | 5.2 | 6.1 | 1.0 | 0.0 | 1.7 | 1.9 | 0.9 | 0.7 | 0.2 |
| Losses | 7 | 5 | 27.9 | 1.2 | 4.9 | 6.2 | 1.4 | 0.0 | 1.0 | 2.1 | 0.5 | 1.6 | 0.2 | |
| Month | November | 3 | 3 | 29.0 | 1.8 | 5.5 | 7.4 | 1.4 | 0.0 | 1.4 | 1.4 | 1.0 | 1.8 | 0.0 |
| January | 8 | - | 21.1 | 0.5 | 4.5 | 5.0 | 1.7 | 0.0 | 1.4 | 1.9 | 0.8 | 0.7 | 0.5 | |
| February | 9 | 5 | 26.1 | 1.2 | 5.6 | 6.8 | 0.7 | 0.0 | 1.7 | 2.4 | 0.7 | 0.9 | 0.2 | |
| March | 1 | 1 | 33.0 | 0.0 | 3.6 | 3.6 | 1.2 | 0.0 | 0.0 | 1.2 | 0.0 | 2.4 | 0.0 |
News Mentions


Men's basketball moves past PSU-Altoona in ECAC First Round, 71-66
February 28, 2018

Jones headlines three All-PAC selections
February 27, 2018

Bethany falls to Thomas More in PAC Tournament Championship, 78-73
February 24, 2018

Bison rally past Westminster in PAC Semifinals, 76-72
February 22, 2018

Bison take out Waynesburg in PAC Quarterfinals, 82-73
February 20, 2018

Bison defeated at Grove City, 66-57
February 17, 2018

Bethany races past Chatham on Senior Night, 82-59
February 14, 2018

Bison hold off Thiel in overtime, 80-77
February 3, 2018

Truex, Davis lead Bison past Geneva, 80-66
January 24, 2018
Hot shooting propels Bethany past Waynesburg, 93-77
January 20, 2018

Bison take down Chatham, 78-64
January 17, 2018

Bethany slides past W&J in OT, 69-66
January 10, 2018

Bison men surge past Thiel, 74-71
January 6, 2018

Bethany comes up short at Franklin & Marshall, 72-70
November 17, 2017

Bison fall in final seconds of season-opener at Susquehanna, 75-73
November 15, 2017

Men's basketball slots fifth in PAC Preseason Poll
November 10, 2017