
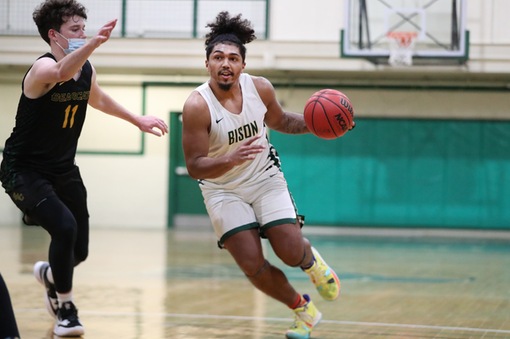
13 Travis Zimmerman
-
- Height:
- 6-6
-
- Year:
- So.
-
- Hometown:
- Wheeling, W. Va
-
- High School:
- Wheeling Park
-
- Position:
- F
-
- gp
- 22
-
- pts/g
- 11.1
-
- fg %
- 47.9
-
- 3pt %
- 0.0
-
- ft %
- 51.8
-
- reb/g
- 6.3
-
- a/g
- 0.5
Bio
As a sophomore (2021-22)(Game-by-Game Statistics):
- Appeared in 22 games, while starting 21
- Averaged 11.1 points and 6.3 rebounds
- Scored a season-high 21 points against Bridgewater
- Had three double-doubles
- Had a season-high 13 rebounds against Geneva
- Finished with 26 blocks and 14 steals
As a freshman (2020-21) (Game-By-Game Statistics):
- Appeared in eight games, starting six
- Averaged 9.3 points and 6.3 rebounds per game
- Made his collegiate debut against Franciscan
- Tallied a season high 16 points against Geneva
- Had 10+ points four times
- Had a double-double against Washinton & Jefferson (10 points, 12 rebounds)
BEFORE BETHANY | PERSONAL:
- Attended Wheeling Park
- Played basketball for Michael Jebbia
- First Team All-Valley | OVAC All-Star
- Son of Kimberly Zimmerman
- Has one brother and one sister
Player Profile
| Overall | Conf | |||
|---|---|---|---|---|
| Games | 22 | 16 | ||
| Games started | 21 | 15 | ||
| Minutes | 630 | 463 | ||
| Minutes per game | 28.6 | 28.9 | ||
| FG | 101-211 | 70-142 | ||
| FG Pct | 47.9 | 49.3 | ||
| 3PT | 0-13 | 0-7 | ||
| 3PT Pct | 0.0 | 0.0 | ||
| FT | 43-83 | 32-61 | ||
| FT Pct | 51.8 | 52.5 | ||
| Off rebounds | 44 | 29 | ||
| Def rebounds | 95 | 77 | ||
| Total rebounds | 139 | 106 | ||
| Rebounds per game | 6.3 | 6.6 | ||
| Personal fouls | 52 | 39 | ||
| Disqualifications | 2 | 1 | ||
| Assists | 12 | 10 | ||
| Turnovers | 40 | 32 | ||
| Assist to turnover ratio | 0.3 | 0.3 | ||
| Steals | 14 | 11 | ||
| Blocks | 26 | 18 | ||
| Points | 245 | 172 | ||
| Points per game | 11.1 | 10.8 | ||
| Points per 40 min | 15.6 | 14.9 | ||
Game Log - Shooting
| Date | Opponent | Score | gs | min | fg | pct | 3pt | pct | ft | pct | pts |
|---|---|---|---|---|---|---|---|---|---|---|---|
| Nov 13 | at Mt. St. Joseph | L, 85-43 | 1 | 29 | 1-8 | 12.5 | 0-2 | 0.0 | 1-2 | 50.0 | 3 |
| Nov 14 | vs. Berea | L, 88-67 | 1 | 29 | 4-10 | 40.0 | 0-2 | 0.0 | 2-5 | 40.0 | 10 |
| Nov 20 | at Penn St.-Behrend | L, 66-55 | 1 | 24 | 2-10 | 20.0 | 0-2 | 0.0 | 1-1 | 100.0 | 5 |
| Nov 23 | Pitt.-Greensburg | L, 83-70 | 1 | 24 | 8-16 | 50.0 | 0-0 | - | 2-2 | 100.0 | 18 |
| Dec 1 | at Franciscan | W, 103-100 | 1 | 32 | 6-7 | 85.7 | 0-0 | - | 0-4 | 0.0 | 12 |
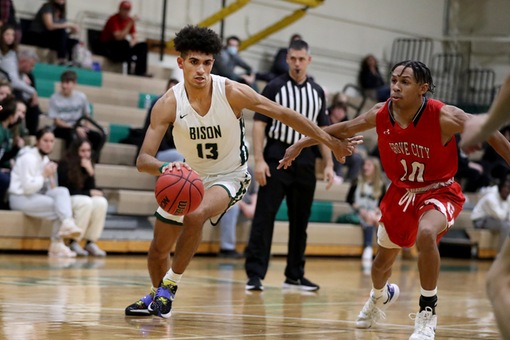
| Dec 4 | Grove City | L, 81-69 | 1 | 31 | 3-7 | 42.9 | 0-0 | - | 5-10 | 50.0 | 11 |
| Dec 7 | at Wash. & Jeff. | L, 103-56 | 1 | 27 | 7-12 | 58.3 | 0-2 | 0.0 | 3-8 | 37.5 | 17 |
| Dec 17 | Bridgewater (Va.) | L, 108-80 | 1 | 31 | 9-16 | 56.3 | 0-0 | - | 3-6 | 50.0 | 21 |
| Dec 18 | Penn State - Shenango | - | - | - | - | - | - | - | - | - | |
| Dec 30 | Carnegie Mellon | - | - | - | - | - | - | - | - | - | |
| Jan 15 | at Westminster (Pa.) | L, 91-66 | 1 | 31 | 2-6 | 33.3 | 0-0 | - | 3-4 | 75.0 | 7 |
| Jan 18 | at Geneva | L, 80-64 | 1 | 34 | 7-16 | 43.8 | 0-0 | - | 2-2 | 100.0 | 16 |
| Jan 20 | Waynesburg | L, 78-56 | 1 | 32 | 3-5 | 60.0 | 0-0 | - | 0-0 | - | 6 |
| Jan 22 | Franciscan | L, 94-70 | 1 | 32 | 5-10 | 50.0 | 0-0 | - | 2-3 | 66.7 | 12 |
| Jan 24 | St. Vincent | W, 57-56 | 1 | 26 | 8-9 | 88.9 | 0-0 | - | 0-6 | 0.0 | 16 |
| Jan 29 | at Grove City | - | - | - | - | - | - | - | - | - | |
| Jan 31 | Chatham | L, 87-61 | 1 | 26 | 5-11 | 45.5 | 0-0 | - | 0-0 | - | 10 |
| Feb 2 | at St. Vincent | L, 67-62 | - | 33 | 4-6 | 66.7 | 0-0 | - | 1-2 | 50.0 | 9 |
| Feb 5 | Geneva | - | - | - | - | - | - | - | - | - | |
| Feb 7 | at Thiel | - | - | - | - | - | - | - | - | - | |
| Feb 9 | Thiel | L, 79-57 | 1 | 34 | 3-7 | 42.9 | 0-1 | 0.0 | 7-8 | 87.5 | 13 |
| Feb 12 | at Chatham | L, 83-51 | 1 | 30 | 6-16 | 37.5 | 0-0 | - | 5-7 | 71.4 | 17 |
| Feb 14 | Wash. & Jeff. | L, 96-74 | 1 | 22 | 3-5 | 60.0 | 0-0 | - | 1-2 | 50.0 | 7 |
| Feb 14 | Wash. & Jeff. | L, 96-74 | 1 | 22 | 3-5 | 60.0 | 0-0 | - | 1-2 | 50.0 | 7 |
| Feb 16 | at Waynesburg | L, 81-44 | 1 | 25 | 2-7 | 28.6 | 0-2 | 0.0 | 0-0 | - | 4 |
| Feb 19 | Westminster (Pa.) | L, 97-64 | 1 | 26 | 3-13 | 23.1 | 0-2 | 0.0 | 2-3 | 66.7 | 8 |
| Feb 21 | at Franciscan | L, 108-89 | 1 | 30 | 7-9 | 77.8 | 0-0 | - | 2-6 | 33.3 | 16 |
Game Log - Ball control
| Date | Opponent | Score | gs | min | off | def | reb | ast | to | a/to | stl | blk | pf | dq |
|---|---|---|---|---|---|---|---|---|---|---|---|---|---|---|
| Nov 13 | at Mt. St. Joseph | L, 85-43 | 1 | 29 | 0 | 4 | 4 | 0 | 0 | - | 0 | 1 | 2 | - |
| Nov 14 | vs. Berea | L, 88-67 | 1 | 29 | 3 | 5 | 8 | 1 | 3 | 0.3 | 0 | 2 | 2 | 0 |
| Nov 20 | at Penn St.-Behrend | L, 66-55 | 1 | 24 | 1 | 2 | 3 | 0 | 1 | 0.0 | 1 | 1 | 2 | 0 |
| Nov 23 | Pitt.-Greensburg | L, 83-70 | 1 | 24 | 5 | 1 | 6 | 0 | 0 | - | 2 | 3 | 5 | 1 |
| Dec 1 | at Franciscan | W, 103-100 | 1 | 32 | 2 | 4 | 6 | 0 | 1 | 0.0 | 1 | 1 | 3 | - |
| Dec 4 | Grove City | L, 81-69 | 1 | 31 | 5 | 6 | 11 | 0 | 1 | 0.0 | 0 | 0 | 5 | 1 |
| Dec 7 | at Wash. & Jeff. | L, 103-56 | 1 | 27 | 0 | 6 | 6 | 0 | 2 | 0.0 | 0 | 2 | 1 | - |
| Dec 17 | Bridgewater (Va.) | L, 108-80 | 1 | 31 | 5 | 4 | 9 | 1 | 2 | 0.5 | 0 | 0 | 1 | - |
| Dec 18 | Penn State - Shenango | - | - | - | - | - | - | - | - | - | - | - | - | |
| Dec 30 | Carnegie Mellon | - | - | - | - | - | - | - | - | - | - | - | - | |
| Jan 15 | at Westminster (Pa.) | L, 91-66 | 1 | 31 | 2 | 2 | 4 | 1 | 0 | - | 0 | 0 | 2 | - |
| Jan 18 | at Geneva | L, 80-64 | 1 | 34 | 5 | 8 | 13 | 2 | 3 | 0.7 | 1 | 0 | 1 | - |
| Jan 20 | Waynesburg | L, 78-56 | 1 | 32 | 1 | 7 | 8 | 2 | 1 | 2.0 | 0 | 3 | 0 | - |
| Jan 22 | Franciscan | L, 94-70 | 1 | 32 | 2 | 5 | 7 | 0 | 2 | 0.0 | 1 | 0 | 2 | - |
| Jan 24 | St. Vincent | W, 57-56 | 1 | 26 | 2 | 3 | 5 | 2 | 2 | 1.0 | 1 | 1 | 4 | - |
| Jan 29 | at Grove City | - | - | - | - | - | - | - | - | - | - | - | - | |
| Jan 31 | Chatham | L, 87-61 | 1 | 26 | 0 | 9 | 9 | 0 | 2 | 0.0 | 2 | 1 | 2 | - |
| Feb 2 | at St. Vincent | L, 67-62 | - | 33 | 0 | 2 | 2 | 1 | 1 | 1.0 | 2 | 1 | 3 | - |
| Feb 5 | Geneva | - | - | - | - | - | - | - | - | - | - | - | - | |
| Feb 7 | at Thiel | - | - | - | - | - | - | - | - | - | - | - | - | |
| Feb 9 | Thiel | L, 79-57 | 1 | 34 | 2 | 9 | 11 | 0 | 4 | 0.0 | 1 | 3 | 2 | - |
| Feb 12 | at Chatham | L, 83-51 | 1 | 30 | 4 | 2 | 6 | 0 | 3 | 0.0 | 1 | 1 | 1 | - |
| Feb 14 | Wash. & Jeff. | L, 96-74 | 1 | 22 | 1 | 5 | 6 | 0 | 1 | 0.0 | 0 | 2 | 4 | - |
| Feb 14 | Wash. & Jeff. | L, 96-74 | 1 | 22 | 1 | 5 | 6 | 0 | 1 | 0.0 | 0 | 2 | 4 | - |
| Feb 16 | at Waynesburg | L, 81-44 | 1 | 25 | 1 | 1 | 2 | 1 | 6 | 0.2 | 1 | 0 | 2 | - |
| Feb 19 | Westminster (Pa.) | L, 97-64 | 1 | 26 | 1 | 3 | 4 | 1 | 2 | 0.5 | 0 | 1 | 3 | - |
| Feb 21 | at Franciscan | L, 108-89 | 1 | 30 | 1 | 2 | 3 | 0 | 2 | 0.0 | 0 | 1 | 1 | - |
Career Stats - Shooting per game
Career Stats - Shooting per 40 min
Career Stats - Ball control per game
Career Stats - Ball control per 40 min
| gp | gs | mpg | off/40 | def/40 | reb/40 | pf/40 | dq/40 | ast/40 | to/40 | a/to | stl/40 | blk/40 | |
|---|---|---|---|---|---|---|---|---|---|---|---|---|---|
| 2020-21 | 8 | 6 | 26.4 | 3.0 | 6.4 | 9.5 | 3.4 | 0.0 | 0.8 | 2.8 | 0.3 | 1.1 | 1.1 |
| 2021-22 | 22 | 21 | 28.6 | 2.8 | 6.0 | 8.8 | 3.3 | 0.1 | 0.8 | 2.5 | 0.3 | 0.9 | 1.7 |
| 2022-23 | 3 | - | 10.7 | 2.5 | 7.5 | 10.0 | 0.0 | 0.0 | 0.0 | 1.3 | 0.0 | 1.3 | 0.0 |
| Total | 33 | 27 | 26.5 | 2.8 | 6.2 | 9.0 | 3.2 | 0.1 | 0.7 | 2.6 | 0.3 | 1.0 | 1.5 |
Splits Stats - Shooting per game
| gp | gs | min/g | fg/g | pct | 3pt/g | pct | ft/g | pct | ppg | ||
|---|---|---|---|---|---|---|---|---|---|---|---|
| Event | Total | 22 | 21 | 28.6 | 4.6-9.6 | 47.9 | 0.0-0.6 | 0.0 | 2.0-3.8 | 51.8 | 11.1 |
| Conference | 16 | 15 | 28.9 | 4.4-8.9 | 49.3 | 0.0-0.4 | 0.0 | 2.0-3.8 | 52.5 | 10.8 | |
| Exhibition | - | - | - | 0.0-0.0 | - | 0.0-0.0 | - | 0.0-0.0 | - | - | |
| Location | Home | 11 | 11 | 27.8 | 4.8-9.5 | 51.0 | 0.0-0.3 | 0.0 | 2.1-3.8 | 54.8 | 11.7 |
| Away | 10 | 9 | 29.5 | 4.4-9.7 | 45.4 | 0.0-0.8 | 0.0 | 1.8-3.6 | 50.0 | 10.6 | |
| Neutral | 1 | 1 | 29.0 | 4.0-10.0 | 40.0 | 0.0-2.0 | 0.0 | 2.0-5.0 | 40.0 | 10.0 | |
| Result | Wins | 2 | 2 | 29.0 | 7.0-8.0 | 87.5 | 0.0-0.0 | - | 0.0-5.0 | 0.0 | 14.0 |
| Losses | 20 | 19 | 28.6 | 4.3-9.8 | 44.6 | 0.0-0.7 | 0.0 | 2.1-3.6 | 58.9 | 10.8 | |
| Month | November | 4 | 4 | 26.5 | 3.8-11.0 | 34.1 | 0.0-1.5 | 0.0 | 1.5-2.5 | 60.0 | 9.0 |
| December | 4 | 4 | 30.3 | 6.2-10.5 | 59.5 | 0.0-0.5 | 0.0 | 2.8-7.0 | 39.3 | 15.3 | |
| January | 6 | 6 | 30.2 | 5.0-9.5 | 52.6 | 0.0-0.0 | - | 1.2-2.5 | 46.7 | 11.2 | |
| February | 8 | 7 | 27.8 | 3.9-8.5 | 45.6 | 0.0-0.6 | 0.0 | 2.4-3.8 | 63.3 | 10.1 |
Splits Stats - Shooting totals
| gp | gs | min | fg | pct | 3pt | pct | ft | pct | pts | ||
|---|---|---|---|---|---|---|---|---|---|---|---|
| Event | Total | 22 | 21 | 630 | 101-211 | 47.9 | 0-13 | 0.0 | 43-83 | 51.8 | 245 |
| Conference | 16 | 15 | 463 | 70-142 | 49.3 | 0-7 | 0.0 | 32-61 | 52.5 | 172 | |
| Exhibition | - | - | - | 0-0 | - | 0-0 | - | 0-0 | - | 0 | |
| Location | Home | 11 | 11 | 306 | 53-104 | 51.0 | 0-3 | 0.0 | 23-42 | 54.8 | 129 |
| Away | 10 | 9 | 295 | 44-97 | 45.4 | 0-8 | 0.0 | 18-36 | 50.0 | 106 | |
| Neutral | 1 | 1 | 29 | 4-10 | 40.0 | 0-2 | 0.0 | 2-5 | 40.0 | 10 | |
| Result | Wins | 2 | 2 | 58 | 14-16 | 87.5 | 0-0 | - | 0-10 | 0.0 | 28 |
| Losses | 20 | 19 | 572 | 87-195 | 44.6 | 0-13 | 0.0 | 43-73 | 58.9 | 217 | |
| Month | November | 4 | 4 | 106 | 15-44 | 34.1 | 0-6 | 0.0 | 6-10 | 60.0 | 36 |
| December | 4 | 4 | 121 | 25-42 | 59.5 | 0-2 | 0.0 | 11-28 | 39.3 | 61 | |
| January | 6 | 6 | 181 | 30-57 | 52.6 | 0-0 | - | 7-15 | 46.7 | 67 | |
| February | 8 | 7 | 222 | 31-68 | 45.6 | 0-5 | 0.0 | 19-30 | 63.3 | 81 |
Splits Stats - Shooting per 40 min
| gp | gs | min/g | fg/40 | pct | 3pt/40 | pct | ft/40 | pct | pts/40 | ||
|---|---|---|---|---|---|---|---|---|---|---|---|
| Event | Total | 22 | 21 | 28.6 | 6.4-13.4 | 47.9 | 0.0-0.8 | 0.0 | 2.7-5.3 | 51.8 | 15.6 |
| Conference | 16 | 15 | 28.9 | 6.0-12.3 | 49.3 | 0.0-0.6 | 0.0 | 2.8-5.3 | 52.5 | 14.9 | |
| Exhibition | - | - | - | 0.0-0.0 | - | 0.0-0.0 | - | 0.0-0.0 | - | - | |
| Location | Home | 11 | 11 | 27.8 | 6.9-13.6 | 51.0 | 0.0-0.4 | 0.0 | 3.0-5.5 | 54.8 | 16.9 |
| Away | 10 | 9 | 29.5 | 6.0-13.2 | 45.4 | 0.0-1.1 | 0.0 | 2.4-4.9 | 50.0 | 14.4 | |
| Neutral | 1 | 1 | 29.0 | 5.5-13.8 | 40.0 | 0.0-2.8 | 0.0 | 2.8-6.9 | 40.0 | 13.8 | |
| Result | Wins | 2 | 2 | 29.0 | 9.7-11.0 | 87.5 | 0.0-0.0 | - | 0.0-6.9 | 0.0 | 19.3 |
| Losses | 20 | 19 | 28.6 | 6.1-13.6 | 44.6 | 0.0-0.9 | 0.0 | 3.0-5.1 | 58.9 | 15.2 | |
| Month | November | 4 | 4 | 26.5 | 5.7-16.6 | 34.1 | 0.0-2.3 | 0.0 | 2.3-3.8 | 60.0 | 13.6 |
| December | 4 | 4 | 30.3 | 8.3-13.9 | 59.5 | 0.0-0.7 | 0.0 | 3.6-9.3 | 39.3 | 20.2 | |
| January | 6 | 6 | 30.2 | 6.6-12.6 | 52.6 | 0.0-0.0 | - | 1.5-3.3 | 46.7 | 14.8 | |
| February | 8 | 7 | 27.8 | 5.6-12.3 | 45.6 | 0.0-0.9 | 0.0 | 3.4-5.4 | 63.3 | 14.6 |
Splits Stats - Ball control per game
| gp | gs | mpg | off/g | def/g | reb/g | pf/g | dq/g | ast/g | to/g | a/to | stl/g | blk/g | ||
|---|---|---|---|---|---|---|---|---|---|---|---|---|---|---|
| Event | Total | 22 | 21 | 28.6 | 2.0 | 4.3 | 6.3 | 2.4 | 0.1 | 0.5 | 1.8 | 0.3 | 0.6 | 1.2 |
| Conference | 16 | 15 | 28.9 | 1.8 | 4.8 | 6.6 | 2.4 | 0.1 | 0.6 | 2.0 | 0.3 | 0.7 | 1.1 | |
| Exhibition | - | - | - | - | - | - | - | - | - | - | - | - | - | |
| Location | Home | 11 | 11 | 27.8 | 2.3 | 5.2 | 7.5 | 2.9 | 0.2 | 0.5 | 1.6 | 0.3 | 0.6 | 1.5 |
| Away | 10 | 9 | 29.5 | 1.6 | 3.3 | 4.9 | 1.8 | 0.0 | 0.5 | 1.9 | 0.3 | 0.7 | 0.8 | |
| Neutral | 1 | 1 | 29.0 | 3.0 | 5.0 | 8.0 | 2.0 | 0.0 | 1.0 | 3.0 | 0.3 | 0.0 | 2.0 | |
| Result | Wins | 2 | 2 | 29.0 | 2.0 | 3.5 | 5.5 | 3.5 | - | 1.0 | 1.5 | 0.7 | 1.0 | 1.0 |
| Losses | 20 | 19 | 28.6 | 2.0 | 4.4 | 6.4 | 2.3 | 0.1 | 0.5 | 1.9 | 0.3 | 0.6 | 1.2 | |
| Month | November | 4 | 4 | 26.5 | 2.3 | 3.0 | 5.3 | 2.8 | 0.3 | 0.3 | 1.0 | 0.3 | 0.8 | 1.8 |
| December | 4 | 4 | 30.3 | 3.0 | 5.0 | 8.0 | 2.5 | 0.3 | 0.3 | 1.5 | 0.2 | 0.3 | 0.8 | |
| January | 6 | 6 | 30.2 | 2.0 | 5.7 | 7.7 | 1.8 | - | 1.2 | 1.7 | 0.7 | 0.8 | 0.8 | |
| February | 8 | 7 | 27.8 | 1.4 | 3.6 | 5.0 | 2.5 | - | 0.4 | 2.5 | 0.1 | 0.6 | 1.4 |
Splits Stats - Ball control totals
| gp | gs | min | off | def | reb | pf | dq | ast | to | a/to | stl | blk | ||
|---|---|---|---|---|---|---|---|---|---|---|---|---|---|---|
| Event | Total | 22 | 21 | 630 | 44 | 95 | 139 | 52 | 2 | 12 | 40 | 0.3 | 14 | 26 |
| Conference | 16 | 15 | 463 | 29 | 77 | 106 | 39 | 1 | 10 | 32 | 0.3 | 11 | 18 | |
| Exhibition | - | - | - | - | - | - | - | - | - | - | - | - | - | |
| Location | Home | 11 | 11 | 306 | 25 | 57 | 82 | 32 | 2 | 6 | 18 | 0.3 | 7 | 16 |
| Away | 10 | 9 | 295 | 16 | 33 | 49 | 18 | 0 | 5 | 19 | 0.3 | 7 | 8 | |
| Neutral | 1 | 1 | 29 | 3 | 5 | 8 | 2 | 0 | 1 | 3 | 0.3 | 0 | 2 | |
| Result | Wins | 2 | 2 | 58 | 4 | 7 | 11 | 7 | - | 2 | 3 | 0.7 | 2 | 2 |
| Losses | 20 | 19 | 572 | 40 | 88 | 128 | 45 | 2 | 10 | 37 | 0.3 | 12 | 24 | |
| Month | November | 4 | 4 | 106 | 9 | 12 | 21 | 11 | 1 | 1 | 4 | 0.3 | 3 | 7 |
| December | 4 | 4 | 121 | 12 | 20 | 32 | 10 | 1 | 1 | 6 | 0.2 | 1 | 3 | |
| January | 6 | 6 | 181 | 12 | 34 | 46 | 11 | - | 7 | 10 | 0.7 | 5 | 5 | |
| February | 8 | 7 | 222 | 11 | 29 | 40 | 20 | - | 3 | 20 | 0.1 | 5 | 11 |
Splits Stats - Ball control per 40 min
| gp | gs | mpg | off/40 | def/40 | reb/40 | pf/40 | dq/40 | ast/40 | to/40 | a/to | stl/40 | blk/40 | ||
|---|---|---|---|---|---|---|---|---|---|---|---|---|---|---|
| Event | Total | 22 | 21 | 28.6 | 2.8 | 6.0 | 8.8 | 3.3 | 0.1 | 0.8 | 2.5 | 0.3 | 0.9 | 1.7 |
| Conference | 16 | 15 | 28.9 | 2.5 | 6.7 | 9.2 | 3.4 | 0.1 | 0.9 | 2.8 | 0.3 | 1.0 | 1.6 | |
| Exhibition | - | - | - | - | - | - | - | - | - | - | - | - | - | |
| Location | Home | 11 | 11 | 27.8 | 3.3 | 7.5 | 10.7 | 4.2 | 0.3 | 0.8 | 2.4 | 0.3 | 0.9 | 2.1 |
| Away | 10 | 9 | 29.5 | 2.2 | 4.5 | 6.6 | 2.4 | 0.0 | 0.7 | 2.6 | 0.3 | 0.9 | 1.1 | |
| Neutral | 1 | 1 | 29.0 | 4.1 | 6.9 | 11.0 | 2.8 | 0.0 | 1.4 | 4.1 | 0.3 | 0.0 | 2.8 | |
| Result | Wins | 2 | 2 | 29.0 | 2.8 | 4.8 | 7.6 | 4.8 | 0.0 | 1.4 | 2.1 | 0.7 | 1.4 | 1.4 |
| Losses | 20 | 19 | 28.6 | 2.8 | 6.2 | 9.0 | 3.1 | 0.1 | 0.7 | 2.6 | 0.3 | 0.8 | 1.7 | |
| Month | November | 4 | 4 | 26.5 | 3.4 | 4.5 | 7.9 | 4.2 | 0.4 | 0.4 | 1.5 | 0.3 | 1.1 | 2.6 |
| December | 4 | 4 | 30.3 | 4.0 | 6.6 | 10.6 | 3.3 | 0.3 | 0.3 | 2.0 | 0.2 | 0.3 | 1.0 | |
| January | 6 | 6 | 30.2 | 2.7 | 7.5 | 10.2 | 2.4 | 0.0 | 1.5 | 2.2 | 0.7 | 1.1 | 1.1 | |
| February | 8 | 7 | 27.8 | 2.0 | 5.2 | 7.2 | 3.6 | 0.0 | 0.5 | 3.6 | 0.1 | 0.9 | 2.0 |
News Mentions
Men's Basketball: Strong First Half Lifts Barons over Bison
February 21, 2022

Men's Basketball: Presidents Cruise in Win Over Bison
February 14, 2022


Men's Basketball: Second Half Surge Lifts Tomcats over Bison
February 9, 2022
Men's Basketball: Bison Clipped by Bearcats
February 2, 2022
Men's Basketball: Strong Second Half Propels Cougars Past Bison
January 31, 2022

Men's Basketball: Bison Unable to Overcome Late Deficit
January 22, 2022

Men's Basketball: Bison Suffer Loss to Yellow Jackets
January 20, 2022
Men's Basketball: Hot-Shooting Eagles Outscore Bison, 102-80
December 17, 2021
Men's Basketball: Bethany Loses Road Game to Washington & Jefferson
December 7, 2021
Men's Basketball: Bethany Falls to Grove City
December 4, 2021

Men's Basketball: Bethany Hits Century Mark to Collect First Win
December 1, 2021

Men's Basketball: Bethany's Comeback to Pitt-Greensburg Falls Short
November 23, 2021

Men's Basketball: Slow Start Hinders Bison in 65-55 Lost to Lions
November 20, 2021

Men's Basketball: Bison Fall to Mountaineers
November 14, 2021

Men's Basketball: Bison Fall in Season Opener
November 13, 2021
Men's Basketball: PAC Releases Preseason Polls
November 2, 2021